Journaling Using Daily Questions in Obsidian
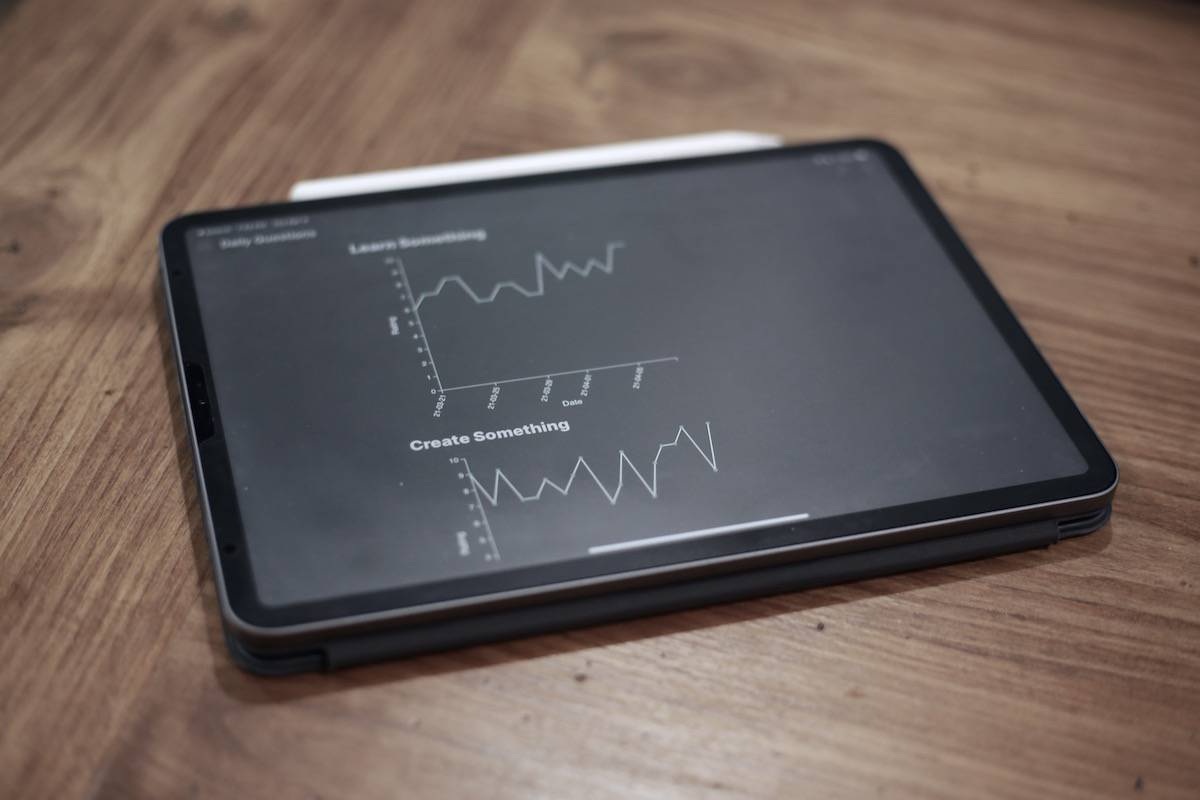
I’m a big fan of the mindfulness I gain from journaling, but have been searching for years for the perfect set of prompts that could completely eliminate the friction from my daily journaling workflow. I’ve tried many different prompts (and many different apps) over the years, but have settled on a practice called Daily Questions which has just clicked for me.
In this post, I’m going to share how I implement my Daily Questions inside of Obsidian. And, speaking of Obsidian….
Before we get too far, if you’d rather watch this in action, here’s a video I made on my whole setup and process:
For those who prefer to read, let’s start at the beginning.
What are Daily Questions?
I first came across the idea of daily questions when I read the book Triggers by Marshall Goldsmith for episode 96 of the Bookworm podcast I co-host with my friend Joe Buhlig. The basic idea is to answer a series of questions every day based on the criteria, “did I do my best to (fill in the blank)?” You simply give yourself a score on a scale from 1 to 10, 1 being low and 10 being high.
The reason this has stuck for me so much better than any journaling prompts ever did is that the Daily Questions are based on your intention. Most journaling prompts I’ve seen are focused on the outcome, for example:
- What did I read?
- What did I learn?
- What did I do for exercise?
If these work for you, more power to you. But what I found from answering these types of prompts for years was that I subconsciously resisted journaling when I didn’t have something impressive to put there. On good days it was easy to fill these out, but on bad days I knew I had nothing to put there so I resisted going into my journaling app.
I didn’t even realize how much friction was there until I started doing the Daily Questions consistently. Once I did, I saw how much easier journaling was for me and realized that I had been “doing it wrong.”
The other thing that made Daily Questions work for me was that it was a great fit for Roam Research. The sliders were the perfect UI for logging my daily questions, but there was still room for improvement: Roam didn’t have a mobile version, and it was still a little cumbersome to pull out trend data without having to go through all the entries manually.
So when I decided to give Obsidian a try, this was one problem that was front of mind for me to try to solve. And it took a little while, but I believe I’ve finally got it.
My Daily Questions Workflow
I’ll break this down in detail later, but here’s what I do every single day now:
- I create a new Daily Note in Obsidian that I use for journaling
- That note pulls in a template that has my Daily Questions prepopulated (along with a few other things)
- I answer my Daily Questions (usually on my Mac, but sometimes on iOS)
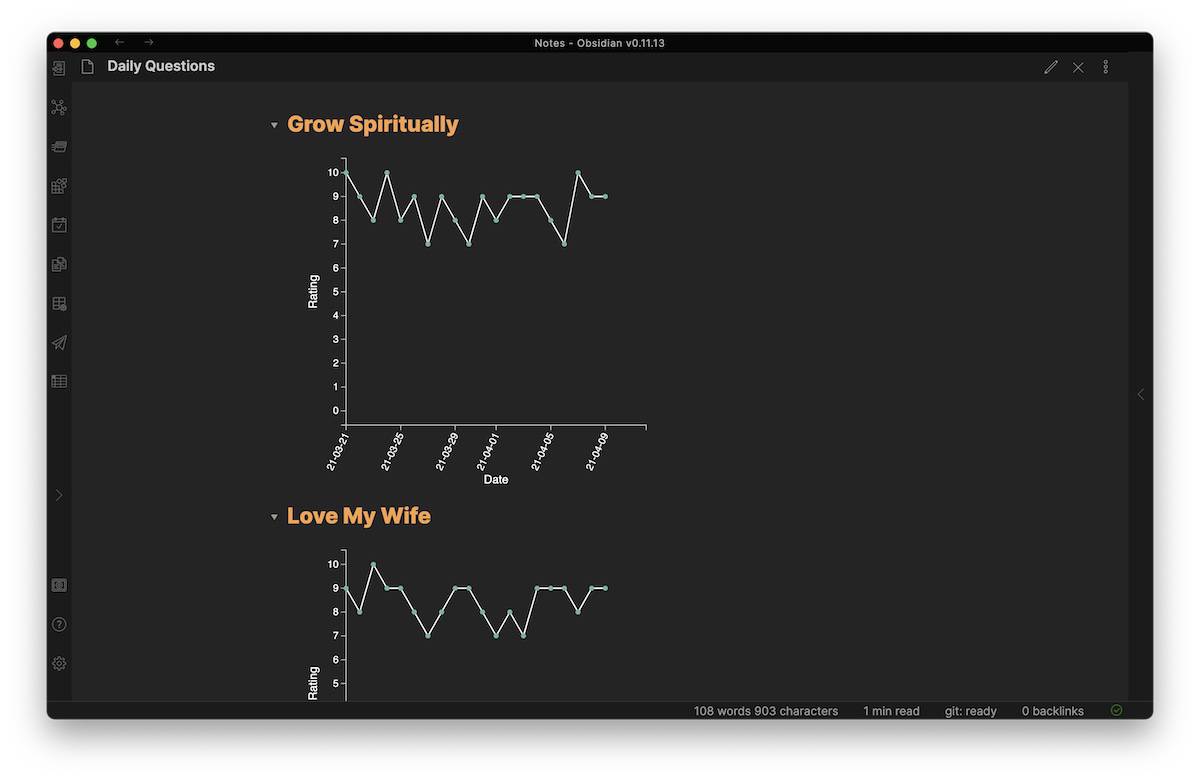
- I use a plugin to chart my responses over time so I can more easily see trends when doing my quarterly review
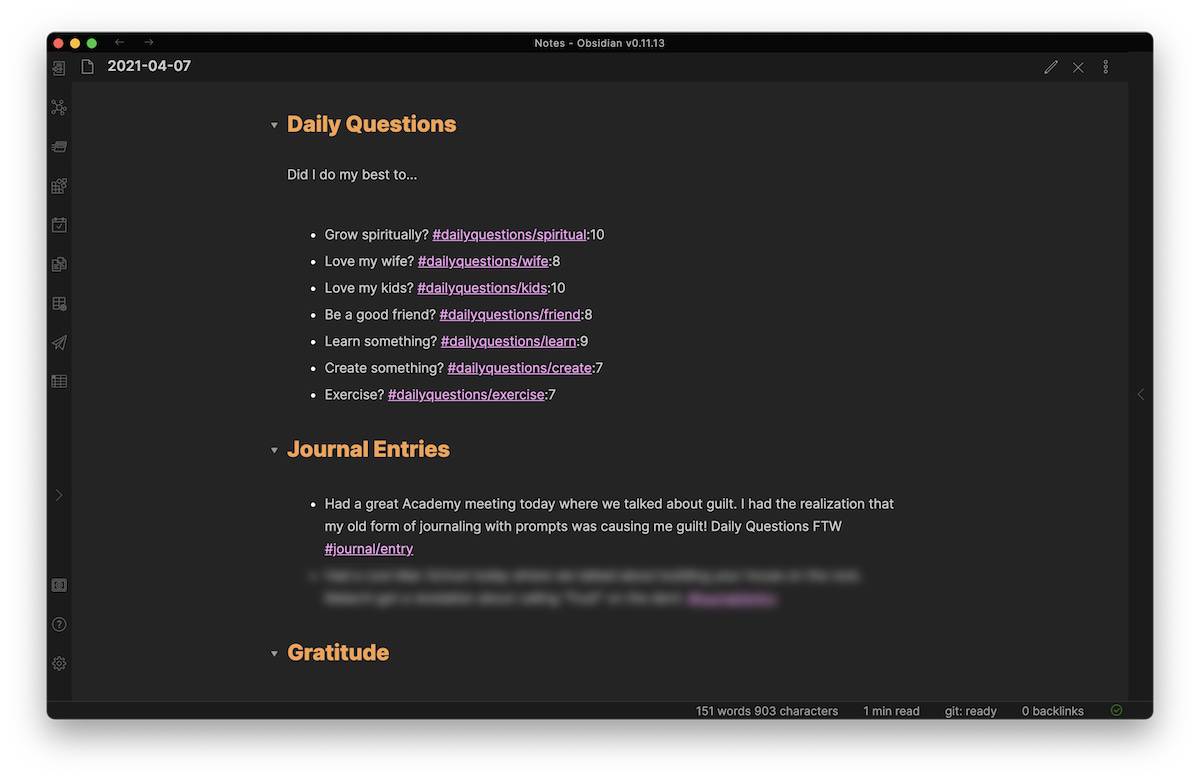
Here’s what my daily note looks like:
And here’s what the charts look like, broken down by individual question:
There are lots of ways you can customize this, but here’s what I personally do to get this data.
Setting Up the Daily Questions Template
The first thing you need to do is create your template with your daily questions. Here’s how I format mine:
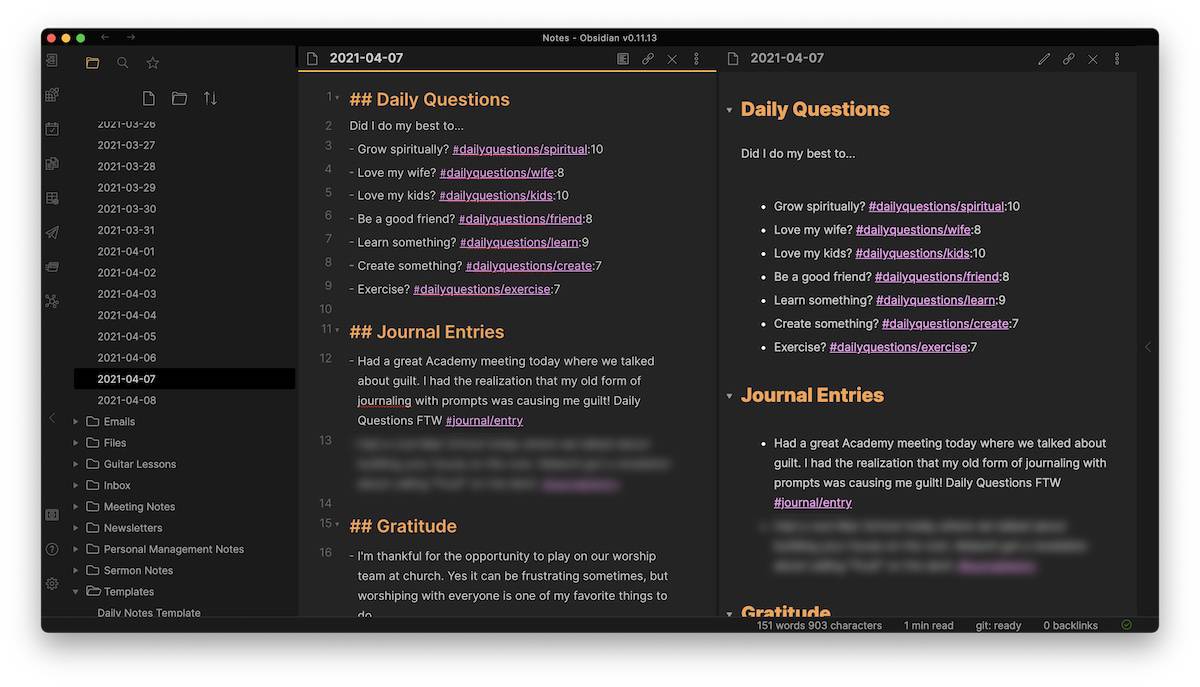
- I use a second-level header for the Daily Questions title
- I use a regular line of text for the question, “Did I do my best to…”
- I nest each question underneath in a bullet list, followed by a nested tag and a rating
Here’s what it looks like side-by-side in both Edit Mode and Preview Mode:
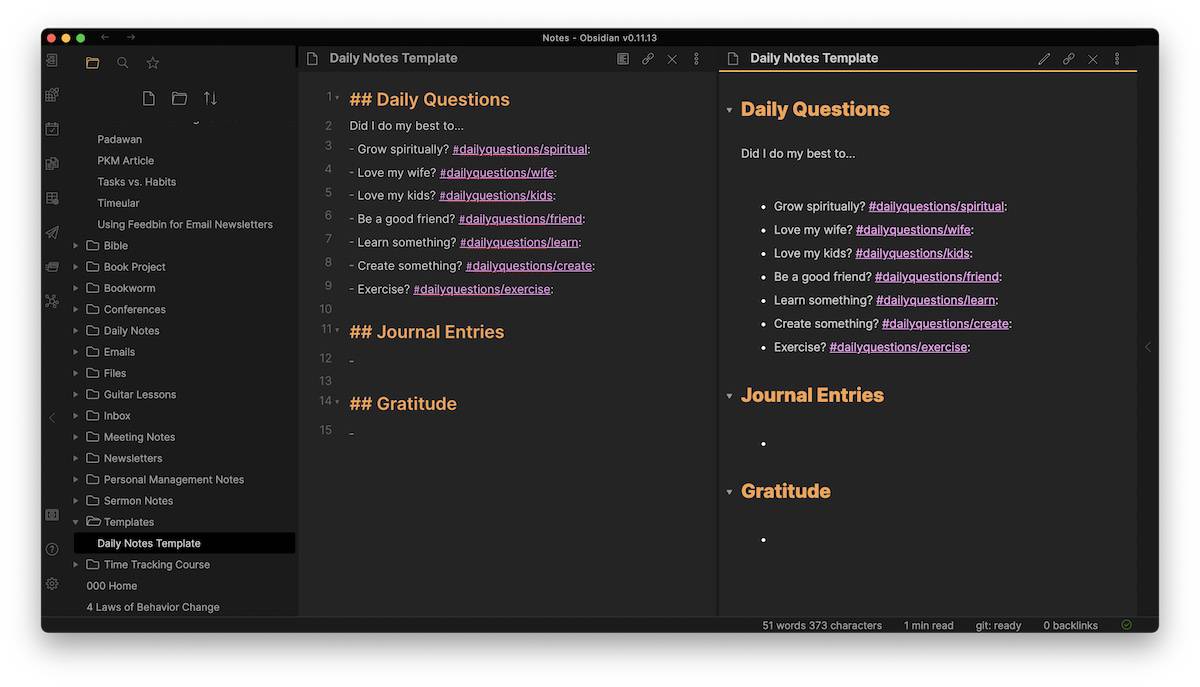
(Note that the Journal Entries and Gratitude sections are not necessary.)
I keep this template inside of a Templates folder, but you can store it wherever you like.
Now that we’ve got the template ready, let’s take a look at the plugins and settings we need.
Setting Up Daily Questions in Obsidian
First, there are a couple of Core Plugins that you need to enable. Core Plugins are extra functionality that is built into Obsidian but turned off by default. The two core plugins we need to enable are Daily Notes and Templates. You can access these by clicking on the gear icon in Obsidian and selecting Core Plugins, and then make sure that Daily Notes and Templates are both toggled on.
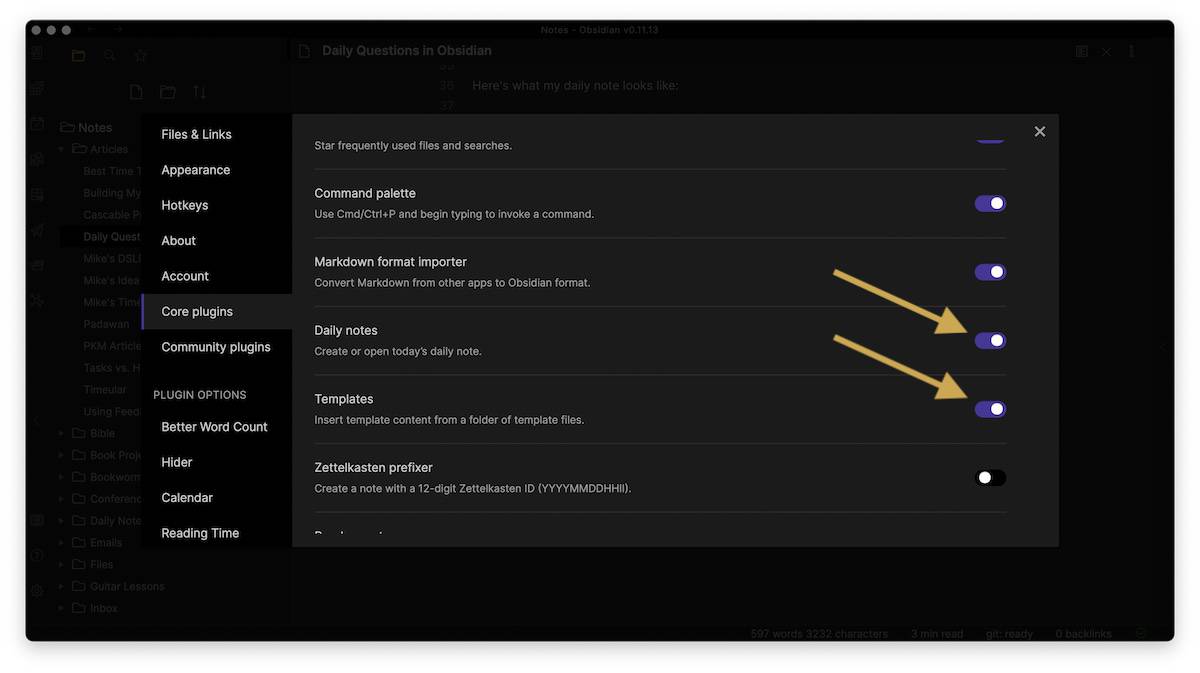
Once they are enabled, you can configure the settings for each plugin at the bottom of the Settings sidebar. Just click on the name of the plugin, and you’ll see the settings for that plugin.
Here are the settings you want to use for the Daily Notes plugin:
- The Date Format can stay the same.
- The New File Location should be set to the folder where you want to keep your Daily Notes (I keep mine inside of a Daily Notes folder).
- The Template File Location should point to the template we set up earlier. This will tell Obsidian what text to prepopulate a new Daily Note with.
- Open Daily Note on Startup doesn’t need to be toggled on (unless you want it to be).
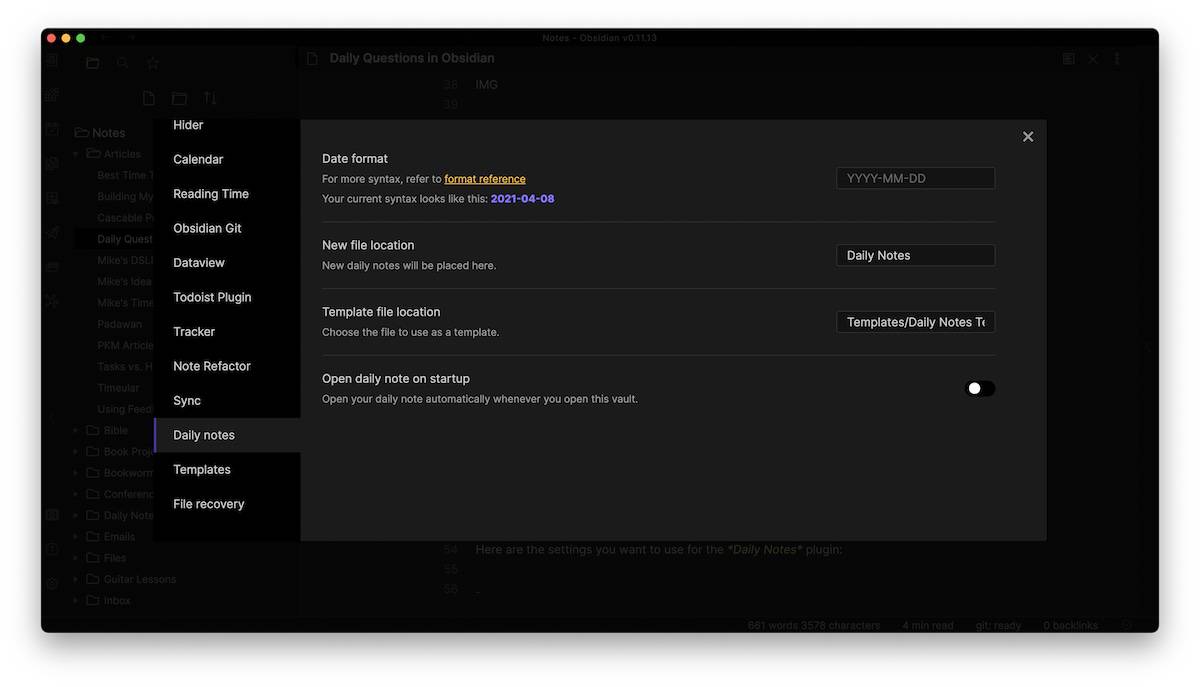
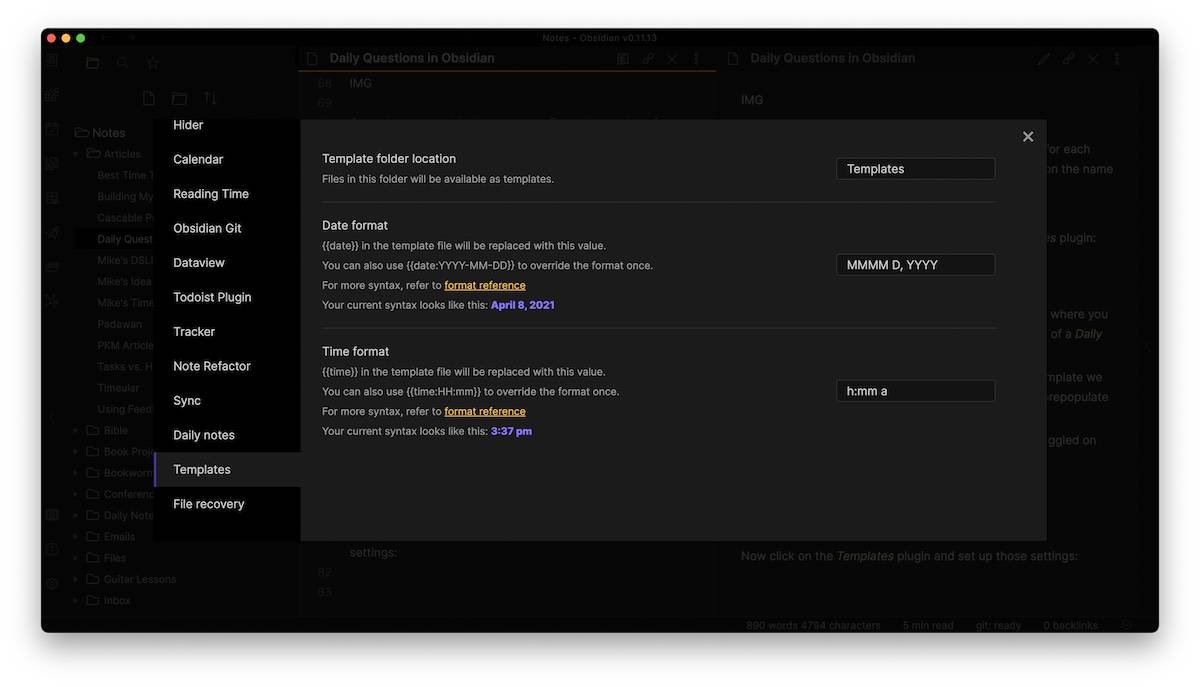
Now click on the Templates plugin and set up those settings:
- The Templates folder location should point to the folder where your templates reside (I recommend you keep these in a separate Templates folder, but you don’t have to)
- The Date format and Time format settings are fine the way they are.
Now we can start using our template to fill out our Daily Questions. Just click the Open today’s daily note button on the left sidebar of the Obsidian interface, and a new Daily Note will open with the template we set up. From here, we can fill out our Daily Questions:
Now we’ve got what we need to start collecting the data for our journaling habit, but there’s still one more piece to set up that can make reviewing this data a whole lot easier.
Introducing Tracker
One of the beautiful things about Obsidian is the ability to use Community Plugins. These are plugins developed by third parties that can significantly extend Obsidian’s capabilities.
The one that we want to use for making it easy to review our Daily Questions data is called Tracker.
To install it, go the Obsidian Settings and then click on Community Plugins. If you’ve never installed a Community Plugin before, you’ll need to toggle off Safe Mode and click the Browse button to see the available Community Plugins:
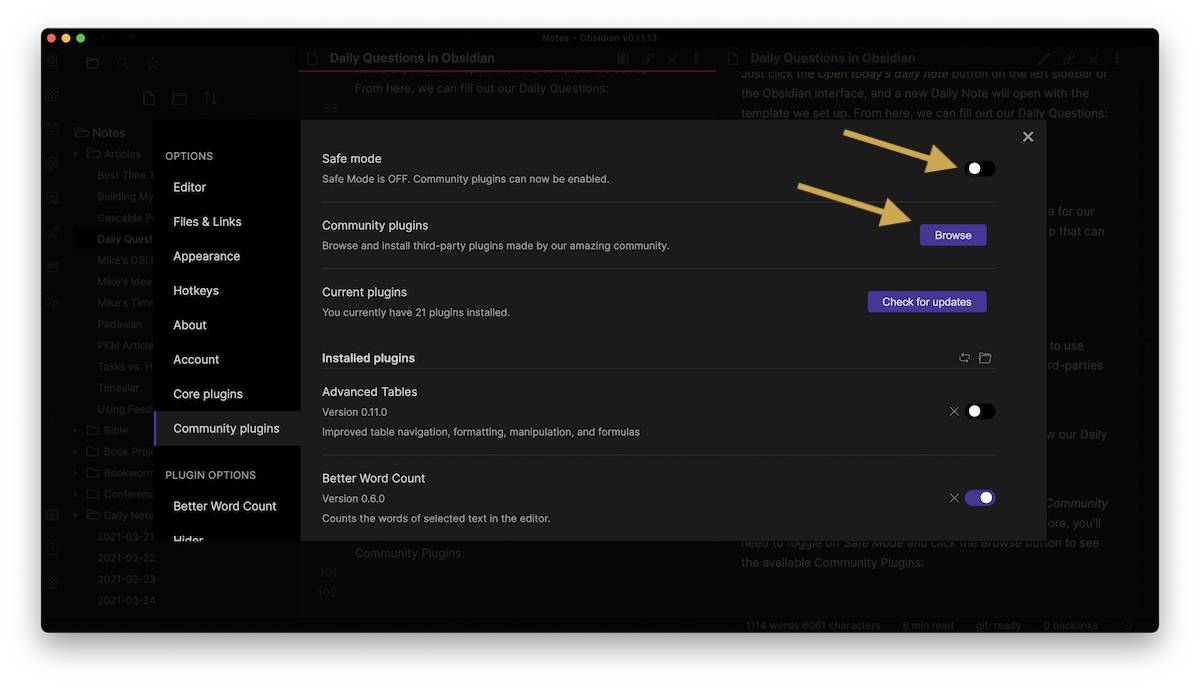
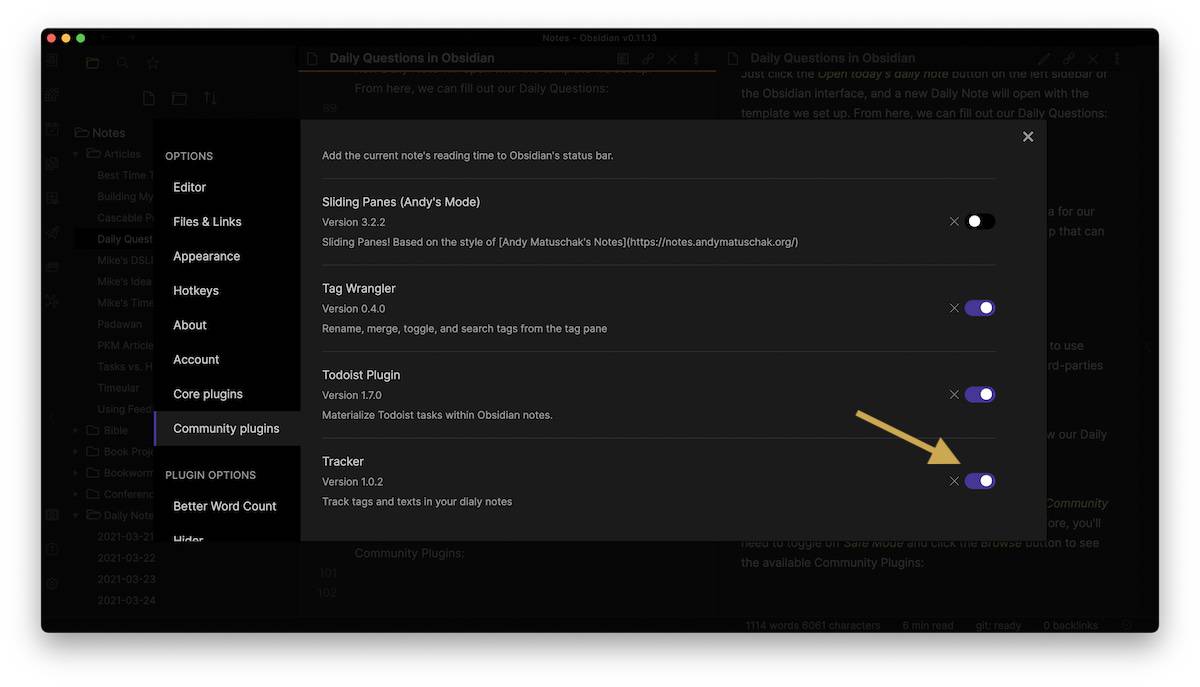
Search for and install the Tracker plugin, then toggle it on just like you did for the Core Plugins:
Next, click Tracker in the settings sidebar to configure the Tracker settings:
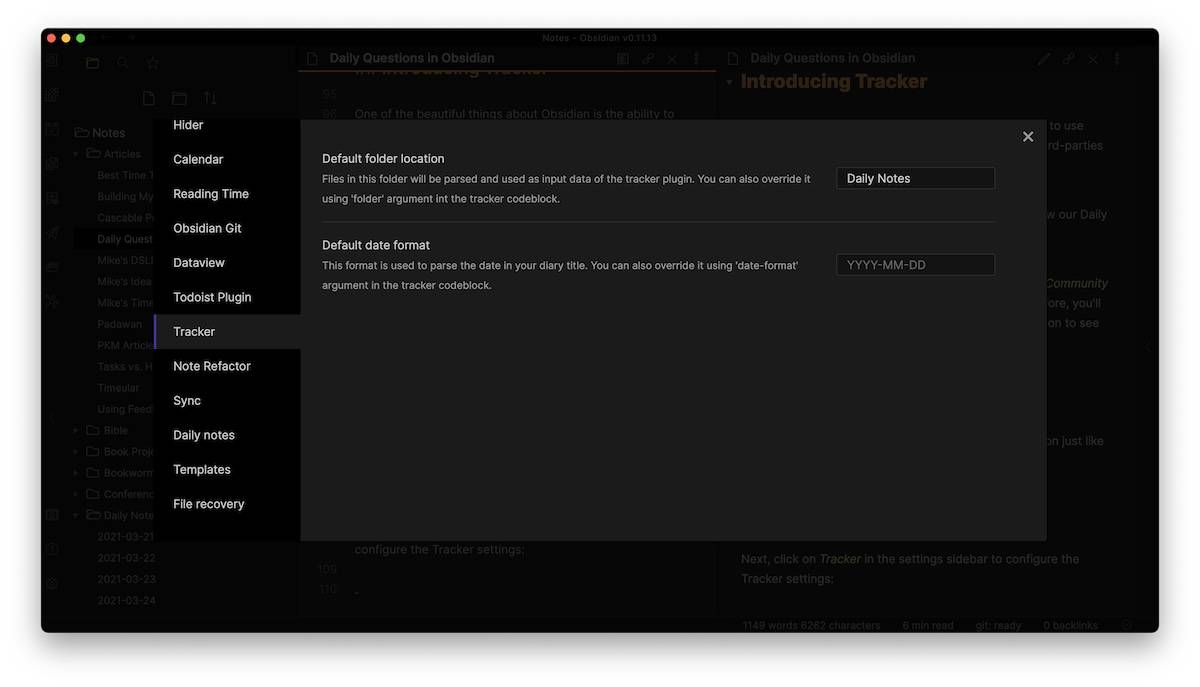
You can leave the Default date format, but make sure that Default folder location is pointing to the same folder where you have your Daily Notes stored.
The Tracker plugin is now setup and can be embedded in any note. I use a separate note called Daily Questions which shows me graphs of each individual question.
To use Tracker, you have to use a code snippet. Here’s an example:
```tracker

searchType: tag

searchTarget: dailyquestions/spiritual

line:

    yAxisLabel: Rating

    yMin: 1

    yMax: 9

```
Here’s what’s going in this code snippet:
- The first line with the three backticks and tracker is activating the plugin.
- The searchType is telling Tracker to look at the tags in the notes in the designated folder.
- The searchTarget is telling Tracker what text to look for (our nested tag, i.e. dailyquestions/spiritual).
- The line section has a couple of options for changing how the line chart renders.
- yAxisLabel changes the label on the side of the chart.
- yMin and yMax control the scale of the chart (this is a little wonky yet, ideally yMin would be 0 and yMax would be 10).
- The closing three backticks indicate the end of the chart information.
(There are a bunch of other settings you can configure for Tracker via the syntax that you use here, beginning and end dates for setting date ranges. See the full plugin documentation for details.)
I use a second-level header for each category and use this exact same snippet under each one, simply changing the tag to reflect the appropriate question. What this does is pull all the values assigned to those tags and plots them on a graph with the values on the y-axis and the date on the x-axis.
Here’s the Edit Mode and Preview Mode side-by-side:
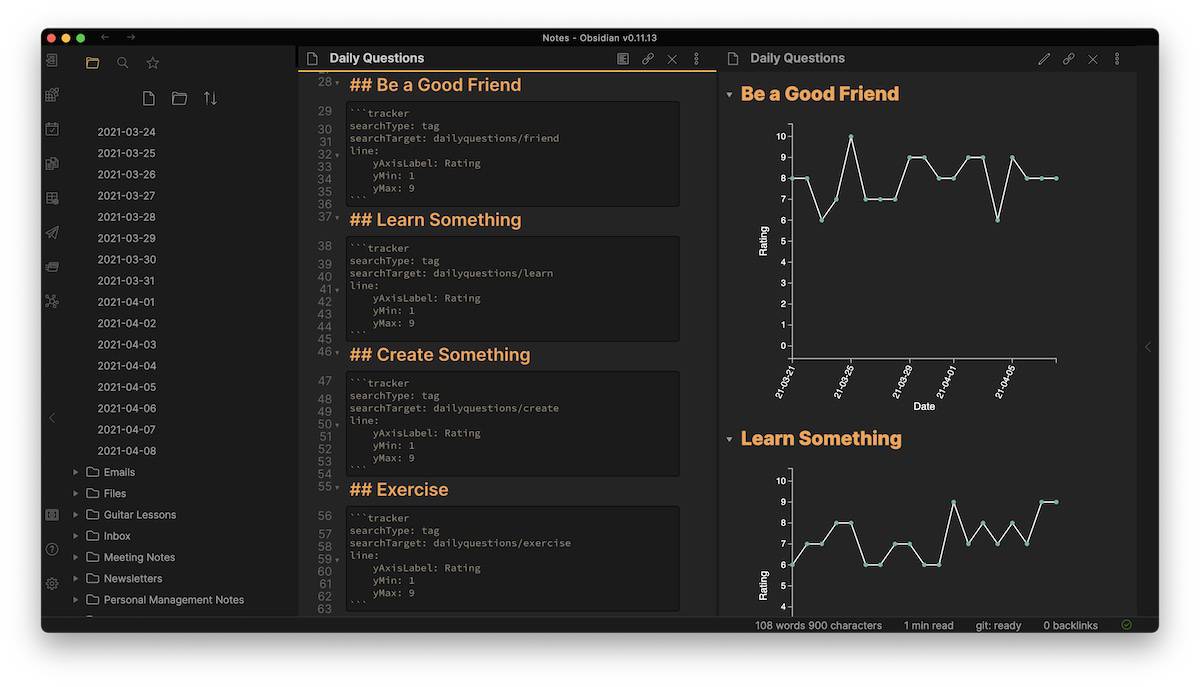
This makes it incredibly easy to review my data and notice any trends when I do my quarterly reviews.
